Quantitative - Data Analysis
Week 7 + 8 - Quantitative Data Collection and Analysis: Quantitative methods are used less in LIS but play an important role in the design of program evaluation and assessment In Weeks 7 and 8 we will briefly discuss how to collect and obtain quantitative data, and how to use descriptive and inferential statistics to pursue a hypothesis.
The dataset described in the standard deviation section can be found here
Lecture Notes
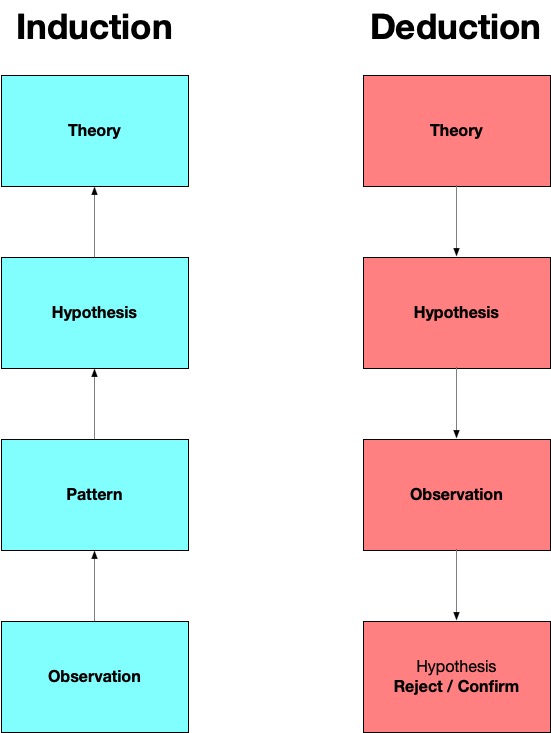
This week we are discussing the concept of analyzing data collected using quantitative methods. In the previous lecture we discussed how the process of data collection in a quantitative studies maps on to positivist logic and uses deduction. In short, I described that when we seek to answer a research question using quantitative methods we are testing hypothesis that confirm or deny an existing generalization. This fits squarely within our deductive logic framework - moving from generalizations about the world (e.g. theories that explain why or to what extent something is true) to specific observations that confirm or deny a generalization in a new context.
Analyzing data quantitatively means that we are seeking to confirm or deny or hypothesis. To do this, we are often measuring or estimating the effect of some observation. For example, lets assume we work in a public library and are interested in circulation of materials. We could state a hypothesis like:
“The circulation of ebooks was greater in 2020 than in 2019.”
This is confirmable and testable hypothesis - we need to have circulation records, including ebooks, for 2019 and 2020 in order to measure the difference between the two years.
In this hypothesis (and the data we need to answer it) we picked out a variable of the data that we might collect. We picked out the ‘ebook’ circulation from the general circulation records. A variable, in this context, means that there is a discrete characteristic of our hypothesis that will vary - it will change from one observation to the next. This change is essentially what we want to control for or measure.
eBook circulation is not just any kind of variable - it is a dependent variable. This means that the variation of ebook circulation rates will DEPEND upon some external factor - like the number of borrowers in a library, the number of ebooks that are available for check-out, the amount of time that lapses between checkouts, etc. These are all examples of independent variables - they occur or vary regularly and INDEPENDENT of our measurement of them. To make this point a little more concrete - a positivist doesn’t believe that time is a social construct - time happens whether or not we choose to measure it. Time exists OUTSIDE of or INDEPENDENT of our measurement of it. But, something like a circulation record is very much a choice - it is a measurement that we choose to collect. When we go to analyze our data then the measurement only takes on meaning if we have another variable that it can depend upon for context. Variations in circulation don’t really mean much unless we have a period of time in which we can reasonably compare one set of circulation records to another, right? So, we need both a dependent and an independent variable to meaningfully test our hypothesis.
Beyond the comparison of data on simple terms - such as dependent and independent variables - we also have quantitive methods that we can use to test or report findings. In this class we’ll discuss just two:
- Descriptive statistics help us describe or show patterns that emerge in our data by giving a narrow definitions of phenomena - such as the average, the most frequent, or the least frequent data points in a study. Descriptive statistics don’t allow us to make firm conclusions, or fully support rejection / acceptance of hypotheses - they just describe. Another way to say this is that they are necessary for understanding a phenomenon, but not sufficient for an explanation of the phenomenon.
There are two types of descriptive statistics:
-
Central Tendency which means the description of data in terms of it’s central position (when distributed or graphed). Descriptive statistics like
Mean(average),median(midpoint), ormode(most often) all describe a central tendency, or a frequency that we can use to describe what might be “normal” or “frequent” about a given set of data. -
Measures of spread is a descriptive statistic that gives a summary of how ‘spread out’ data are. A good example of this is
standard deviation, or how normal it is for one data point to “deviate” from the normal central tendency.
- Inferential statistics are used to build knowledge about or predict things about data that belong to a sample. Remember, that when we create a sample we are saying that it is “representative” of a a larger group (the population). Inferential statistics can help us predict, suggest, or infer how representative that sample is of a population. This happens in two ways: 1. Estimating parameters or by 2. Testing hypothesis.
Readings
You have two choices this week for readings - the first is primarily an overview of descriptive statistics, and the second is further reading in a book about quantitative methods.
-
Doucette, L. (2017). Quantitative Methods and Inferential Statistics: Capacity and Development for Librarians. Evidence Based Library and Information Practice, 12(2), 53-58. PDF
-
Blaikie, N. (2003). Analyzing quantitative data: From description to explanation. Sage. PDF Continue to read Ch 1 from pages 28-36 - this covers analysis and logic of quantiative data, and also nicely summarizes the main points of the entire first chapter.
LIS Research Spotlight
- Harper, C. (2018). Machine Learning and the Library or: How I Learned to Stop Worrying and Love My Robot Overlords. Code4Lib Journal, (41), 6. HTML
Suggested
- Zhang, J., Wang, Y., & Zhao, Y. (2017). Investigation on the statistical methods in research studies of library and information science. The Electronic Library. HTML (This gives a great overview of how often and what kinds of statistics are used in LIS research)
Exercise
Forthcoming