Quantitative - Methods for Data Collection
Week 7 + 8 - Quantitative Data Collection and Analysis: Quantitative methods are used less in LIS but play an important role in the design of program evaluation and assessment In Weeks 7 and 8 we will briefly discuss how to collect and obtain quantitative data, and how to use descriptive and inferential statistics to pursue a hypothesis.
Slides for the lecture are here
There are two referenced readings in the lecture:
- The E-book Power User in Academic and Research Libraries: Deep Log Analysis and User Customization https://doi.org/10.1080/00048623.2014.885374
- Public library computer training for older adults to access high-quality Internet health information https://doi.org/10.1016/j.lisr.2009.03.004
Quantitative Data Collection Methods
I’m going to start this week’s chapter out with a question:
What is at stake, conceptually, when data are collected to make sense of the social world?
That is a hard question to answer. It cuts to the heart of many things we’ve been studying throughout the quarter - such as ethics, justice, beliefs, evidence, and validity. We would probably answer a question like that by saying, “Well, it depends…””
The stakes of social inquiry aren’t necessarily life and death. They are usually about whether we are right or wrong. And whether we are right or wrong depends on what kinds of questions we ask and what constitutes a correct answer. When engaging in social science research what we’re trying to uncover or explain are facts about how the world works - why people behave the way that they do, what preferences lead to decision making, what motivates us to take some particular action, etc. All of these questions require us to be up front about what kinds of data, or explanations, we believe will provide a valid answer. And, while the results don’t have implications for life and death, often the results do have implications on people’s lives - sometimes in profound ways.
This introduction is in defense of angst that may set in at the end of a long hard first quarter of graduate school. The world around us - both the natural and social world - seems to be in a state of constant upheaval. It can often feel deflating, especially right now, to be studying conceptual or even theoretical aspects of research instead of taking direct action. But, I don’t think we need to see the two as wholly divorced from one another. Often times social science research has important contributions to make in solving the most vexing of societal problems - but the results take time, diligence, and patience. The interventions we make based on the values and ethics we hold are valuable to advocating for change.
Positivism
Thus far, we’ve approached research through theoretical paradigm that assumes reality is socially constructed. Another way to say this might be that besides basic laws about the natural world (e.g. gravity) what society consists of are groups of people, organizations, or even institutions that are governed by rules, and those rules are intentionally constructed. As social scientists we want to make sense of this socially constructed world - and we do this by trying to observe and then interpret actions, behaviors, or preferences.
The other major paradigm of social inquiry, which we’ve not yet talked about in detail, is positivism. Positivists aren’t nearly as comfortable with making sense of the social world through interpretation. All the messiness and subjectivity that comes along with qualitative interpretations mean there is little room for saying that one person is right and another person is wrong. To a positivist, much of the research literature produced by constructivists seems to be strongly argued opinions about the social world which, given their subjectivity, are hard to build upon in meaningful ways.
A positivist sees the world as having some core truths or realities that, given enough data, can be accurately measured and predicted. This assumption - that a truth about the world is objectively knowable - has important consequences for how a positivist goes about designing and executing a research project. Because in order to be “right” we have to state in advance what we believe (based on our belief about the state of reality) and then make observations about those beliefs and either confirm or deny or beliefs.
Let’s use a simple example to explore the process of prediction using a positivists logic:
*One fall afternoon you get bored and go to a horse racing track with some friends. In advance you read up on all of the horses that will be racing. One of your ideas is that horses who were born in Virginia (a state with high annual rain fall) will race particularly well in rainy weather. Now just as you get to the track you see that it starts to lightly rain. So you look up all the horses racing that day and find one (and only one) was born and trained in Virginia. So you pick the horse “Cavalier” (the one born in Virginia) who is running in the third race.
The third race comes around, the gun goes off, and you watch the horses speed around the track. Sure enough, Cavalier comes through in first. You exclaim “I knew it!”*
Why should your friends believe you? Did you write down your belief and your justification? Did you place a wager on Cavalier to win? There’s nothing about the event that tells anyone that you had justifiable reasons to believe that Cavalier was going to win, or even that you actually did believe that Cavalier would win.
This seems like a silly example, but in fact it holds all elements of a deductive research experiment that would seem realistic to a positivist. We had a belief [That horses born in Virginia run best in the rain] we had experimental conditions [rain] and we had an observation [a horse born in Virginia running in the rain] as well as a control for confounding effects [other horse, also running in the rain, but not born in Virginia]. So we were able to test our hypothesis, and accept the premise that horses born in Virginia run well in the rain.
Our simple experiment isn’t very robust - we have only one observation in one event. If we were to gather more observations at more events we might be able to prove that our belief was true. That is, we might be able to conclusively show that race horses born in Virginia are better at running in the rain than horses born in other states. To the positivist this kind of hypothesis is very attractive - it can be tested and a clear answer can be generated.
Deductive Logic
Positivism is driven by a deductive logic. It requires that we move from a general belief (hypothesis) to a specific set of observations that confirm or deny our original belief. When designing quantitative studies we are going to start out with stating what we believe, and why believe something. These are our hypotheses about the social world.
We then design our data collection methods to collect data which can test our hypotheses. This test should give conclusive evidence - meaning that in collecting and then analyzing our data we should be certain that the result we get is not by chance, but is actually a true effect. Put another way, if we want to confirm that our beliefs are true then we have to take extra care to make sure that there are no confounding factors that might impact our observations.
Think back to the horse racing example - if we wanted to test our hypothesis about the place of birth impacting the speed of a racehorse under rainy conditions - then we need to make sure that, for example, all of the races happen on the same length of track (2km vs 1.9km), or maybe the same surface of track (dirt vs grass), etc. By having a set of observations (data) that are similar we can ensure there are no external factors that will “confound” the results.
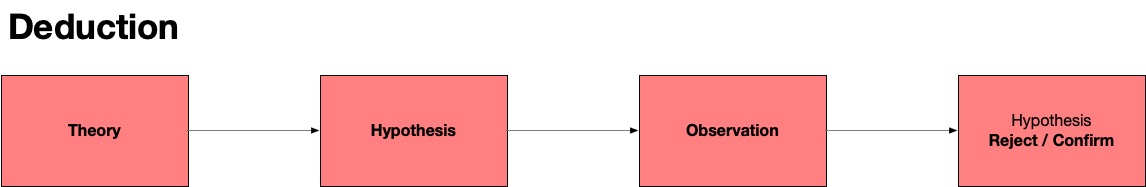
One important point to note about the difference between deductive and inductive logic: All along we’ve described these two about being opposite approaches to gaining knowledge that is general or specific. Induction, in moving from observation to theory is also about moving from specific to general. Deduction is about moving from the general to the specific. But, this might seem a little confusing - especially given the image above. This makes it appear as all that deductive logic achieves is a confirmation or rejection of a hypothesis. In some sense, this is true. But, remember that our hypothesis are standing in for specific things we believe given an existing theory. To test a new hypothesis means that we are also refining, improving, or even refuting an existing theory. It is in this way - by the additional knowledge gained about an existing theory - that deduction moves from general beliefs to specific findings.
Collecting Data using Quantitative Methods
For the next two weeks we are going to explore quantitative methods and deductive logic. As such, we are going to focus our attention on the generation of hypotheses and the use of systematic research methods for collecting data to test those hypotheses.
In the context of the four research stages that we discussed a few weeks ago [^1], we are moving from Design to Execution. But, remember just like qualitative methods, there are two important concepts of research design that are method dependent, and so we need to pull those forward as begin data collection:
- The instrument that will guide our research data collection; and,
- A plan to manage our collected data responsibly.
We will review three particular methods of data collection in the quantitative tradition - but please note that there are many other methods that exist for both collecting and analyzing data deductively.
The three methods we will focus on are surveys, experiments, and trace or log analysis. For each method we’ll first discuss the goal, and value to using this approach. We will then describe relevant sampling methods, what data are produced, and how we should consider the sensitivities of these data as we manage a research project over the long-term.
Survey
Surveys are one of the most popular forms of data collection in the social sciences. Surveys have an immense value to the social scientists, in part, because a structured questionnaire can be easily and broadly disseminated (e.g. a simple email). Another value to survey as a data collection method is that the structure of a questionnaire makes answers (data) well organized for analysis. This self-reported data also enables information about people (e.g. demographics like “education status”) to be correlated with what they believe, think, or feel - creating the ability to generalize about, say, college educated voters in the Midwest of the USA.
Many of us are familiar with questionnaires as a form of data collection about our preferences. Marketing, consumer, or end-user surveys are ubiquitous on the web for all of the reasons described above - they are easy to administer, analyze, and share results.
- Overarching value: Self-reporting, scale, controlled measures, replicable
-
Sampling: Distribution-based sampling. Key to sampling errors (possible to have population level surveys)
- Instruments: Questionnaire (survey questions), occasionally extensible media that accompany questionnaire
Data are structured information that include two types of variables:
- Categorical variables have values that describe labels or attributes.
- Nominal (Nationality, gender, etc)
- Ordinal (small, medium, large) <— Scale
- Numerical variables have magnitude and units, with values that carry an equal weight.
- Discrete - specified values (dates, size of household)
- Continuous - any real number (temperature, height, etc)
Experiment
Social science experimentation is expensive, time consuming, difficult, and likely to yield small N data. But for all of these drawbacks it allows for the design of specific interventions that test behavior, preference, and motives in ways that no other method can. The design of an experiment requires at minimum a control vs an intervention - and most commonly randomized control of multiple samples.
- Overarching value: Maximum control, small cohort, direct measurable intervention.
- Sampling: Specific recruitment, screening, compensation. Often about easy to find populations (note this is a good / bad thing - WEIRD)
- Instruments: Administrator, task / intervention, recording•Data: Very clear dependent and independent variables recorded - typically by administrator, but sometimes as log of interaction
- Example pub: Public library computer training for older adults to access high-quality Internet health information https://doi.org/10.1016/j.lisr.2009.03.004
Trace and Administrative Data
Increasingly quantitive researchers can look to what are called natural experiments or opportunistic data collection based on logged events. Data that stands in for an approximate TRACE of action (clicks, comments, tweets, etc) can be used to infer motivation, behavior, etc.
-
Overarching value: Low cost, combinable, scalable, bias-free•Sampling: Usually without choice, or with minimal control (e.g. we can select a time frame to sample, a word choice, etc)
-
Instruments: Scraping data, administrative data (API), log data - all of these require the use of data collection instruments that are
-
Data: Structured information that requires design of analysis based on researcher identifying variables (time stamps, etc)
-
Example pub: The E-book Power User in Academic and Research Libraries: Deep Log Analysis and User Customization https://doi.org/10.1080/00048623.2014.885374
Readings
There are three choices of readings for this week - an explanation follows each of the three choices:
-
Goertzen, M. J. (2017). Introduction to quantitative research and data. Library Technology Reports, 53(4), 12-18. PDF - this is a general reader on how to do quantitative research in an LIS setting. If you are looking to understand some basic concepts, but not dive deep into quantitative research methods this is the most appropriate reading for you.
-
A Meadows, K. (2003). So you want to do research? 4: An introduction to quantitative methods. British Journal of Community Nursing, 8(11), 519-526. PDF - This is an introduction to thinking with quantitative methods, and focuses on examples in survey research.
-
Blaikie, N. (2003). Analyzing quantitative data: From description to explanation. Sage. PDF This is one of the most thorough and approachable introductions to question asking, data management, collection and analysis using quantitative methods. I have provided the entire book, but for this week you should read Ch 1 from pages 10-27 (stop at the section that begins ‘Transformations between Levels of Measurement’)
LIS Research Spotlight
Jæger, M. M., & Blaabæk, E. H. (2020). Inequality in learning opportunities during Covid-19: Evidence from library takeout. Research in Social Stratification and Mobility, 68, 100524. HTML
Suggested
Hobbes, M. & Marshall, S. (2020, Jul. 27). Murder. You’re wrong about audio podcast Note: The episode begins with the question relating to the frequency of homicides being solved over time, and continues on to engage with relationships between the findings from numerous different quantitative datasets relating to homicide. the discussion does not involve any graphic details about homicides themselves; the hosts are mostly engaged with how data is collected and interpreted in strategic ways to answer questions about homicides, and the broader social implications of conclusions made from these datasets. towards the end of the episode, there is a somewhat graphic description of an example of police brutality.
Exercise
Forthcoming